Excel Reports – something new in reporting space
Last week I have been exploring the Excel Layouts which are a brand new feature in Business Central version 20 (Wave 1 2022). I did not only watch the video from the Launching Event, but I also developed one of the reports. If you want to know what I think of it check below.
Really? Do we need Excel Reports? We have Power BI, Save as Excel, and much more…
I am guessing some of you have that thought in your heads. This is a valid question. Many things that Excel can Power BI can do also or even better. We already have a good connection with that tool in Business Central.
But there are a lot of cases that Power BI cannot be used, or users do not want to use it and still need to process or even manipulate (grrrr) the data – and Excel is perfect for that.
It is also much simpler for the users to understand when you explain how to get the data. I had many times a conversation “Can we have a report which shows this and that?”. And now try to explain how to do the Power BI, connect to it login, etc. instead of simply answering: “Yes. Here it is. With all pivot tables that you need”.
Don’t get me wrong I like Power BI dashboards and Excel reports not always can replace them. But I think it is not also the intention of Microsoft.
I am a dinosaur
But probably you too if you remember how the export the data using Excel Buffer table with all formatting cool features. I remember that one of the first tasks (but also many that I had for over a decade) was to export existing reports to Excel. Then we got a function to open in Excel which help a lot. But still, it requires a lot of skills to do it well – development skills.
One of the thoughts from Kennie in the Launching Event Session was that Excel Reports can shift the responsibility from developers to consultants in terms of layout. So, the developers can deal with a dataset but consultants or even end-users can do the layout for the Excel report.
I love the idea, to be honest. First, it is easier for the consultants to add the columns, charts, formulas, etc. than have a whole dialog with a developer. Second, let’s be honest the reports are something that most developers hate to do.
Estimating the time
Even yesterday I got a question from my consultant friend “Is it much more effort to do excel export or printout?“. And I answered that in version 20 it is even simpler to do Excel export than printing layout than it was in previous versions. When now doing estimates we need to ask the question – what is the purpose of the report is simple Excel export enough or does someone want to print it.
Developing the Report with Excel Layout
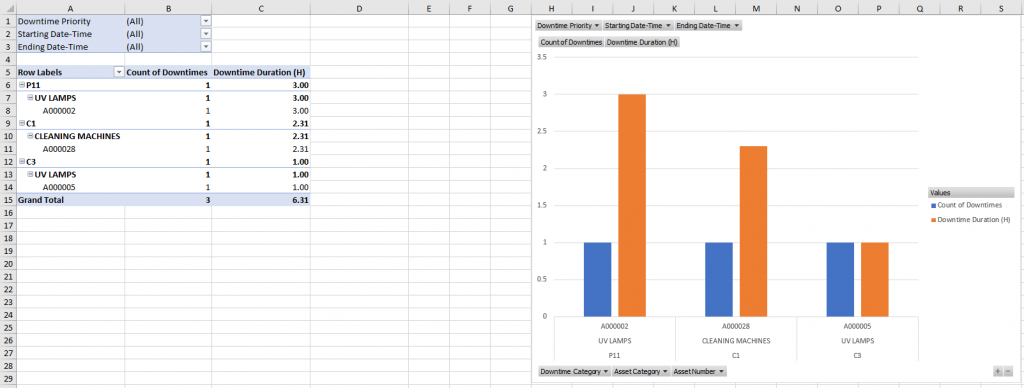
One of my customers asks if we can deliver the report in Excel which he is using for the last 10 years and he was very happy when I told him that we can do it and it should not be a big problem with all the pivot tables. To be honest I treated that case as a test of the Excel Layouts.
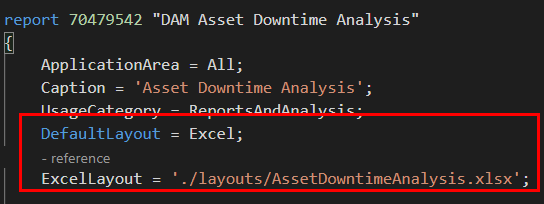
So how to start? Simple do what you did for years. Do the dataset first. Nothing changed in that area (almost). Then add the Default Layout as Excel and add the ExcelLayout path.
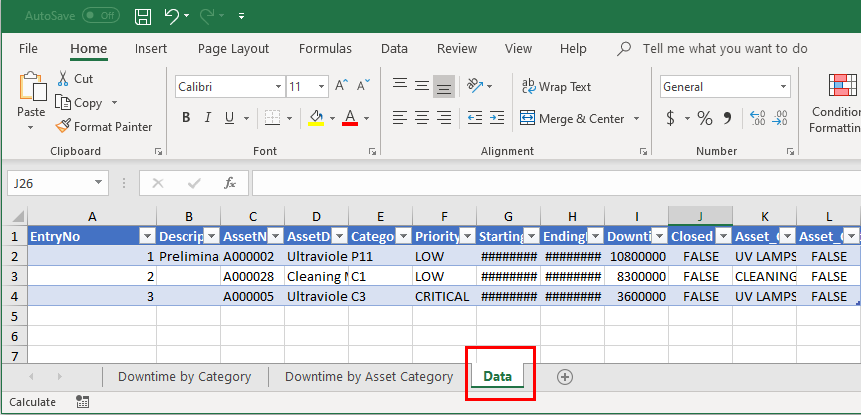
When you compile the Excel will be created in a specified location. It will have one tab – Data. This is one that you should not change. And from now on you can start developing the layout. This is simple as that.
Small tips during development
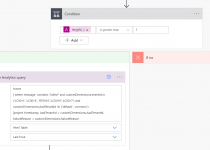
After the first compilation, the data tab is not automatically refreshed when you add new columns or remove existing ones. Remember to make sure that your set matches the data structure since either you will be missing some things, or you will get an error during compilation.
![]()
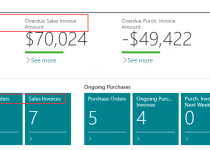
Remember also that you cannot run the report if there is no data for it – it is a little different from other layouts so you need to have at least one testing record just to see the structure.
![]()
Telemetry with Power Automate – how to get the report directly on your mailbox
Open-Source Project: Translate the data with Azure Translator
2 Comments